
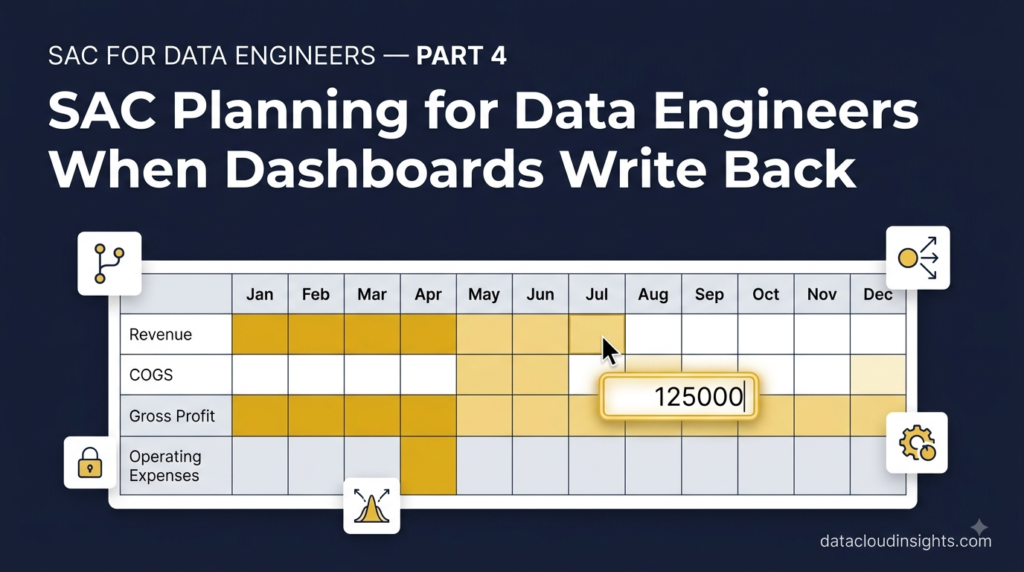

This is Part 4 of our SAP Analytics Cloud Terminology Series. In Parts 1 to 3 we followed Marie — a data engineer from Azure and Databricks — through her first SAC project at RetailCo France. She survived the kickoff meeting, the data modelling workshop, and built her first Story. Now the planning workshops begin. Marie is still here — but honestly she is doing fine now. This part is less about her journey and more about the concepts themselves, because Planning is where most SAC beginners genuinely struggle — not from lack of intelligence but from lack of context. Let us fix that.
Why Planning confuses people who come from a data background
If you come from data engineering, BI development, or even SAP functional consulting outside of finance — SAC Planning feels strange at first. Not because it is technically complex. But because it breaks a rule that every data person internalises early in their career.
The rule is: data flows one way. Into the system. Not out of it.
Pipelines bring data in. Transformations clean it. Models structure it. Reports display it. Nobody types numbers into a dashboard. That would be insane.
SAC Planning is built entirely on breaking that rule.
Finance managers open a dashboard and type numbers directly into cells. They enter budgets. They enter forecasts. They enter targets. They write data back into the SAC Planning Model — and that data immediately appears in reports, charts, KPI tiles, and variance analyses across the entire organisation.
For a data engineer this feels wrong for approximately two weeks. Then it starts feeling like the most natural thing in the world. Because the alternative — emailing Excel files, manually consolidating spreadsheets, arguing about which version is the final version — is genuinely terrible and everyone who has lived through a corporate budget cycle in Excel knows it.
SAC Planning replaces that chaos with a structured, governed, collaborative process. Four terms are the foundation of everything. Master these and the rest of Planning makes sense.
Version — the concept that makes Planning possible
Everything in SAC Planning belongs to a Version.
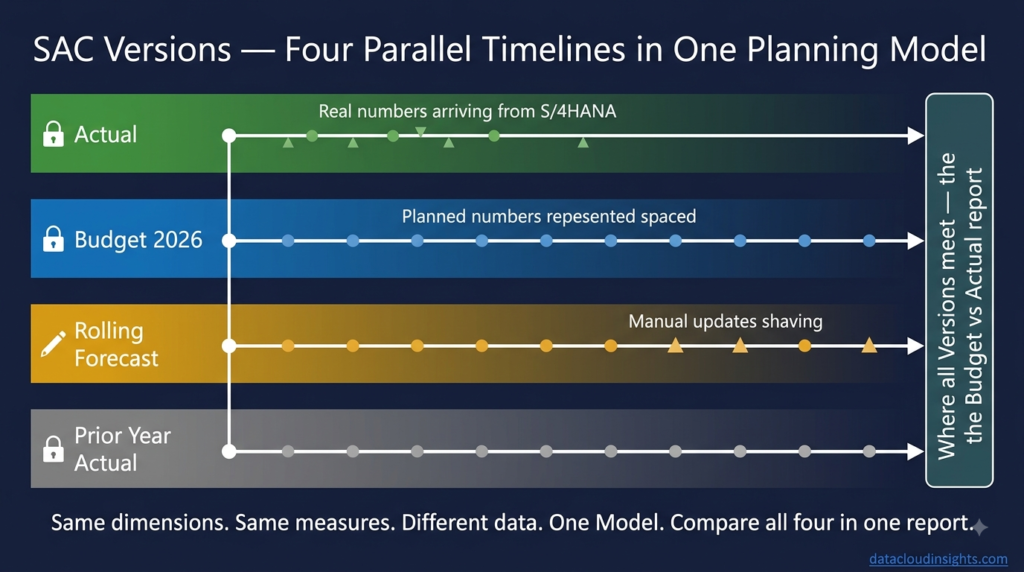
A Version is a named container for a specific set of planning data. Think of it as a scenario label that tags every number in your Planning Model. This number belongs to Budget 2026. That number belongs to Forecast Q3. This one is Actual data imported from S/4HANA.
RetailCo’s Planning Model has four Versions:
Actual — real financial data imported automatically from SAP S/4HANA every night. Nobody enters Actual data manually. It flows in from the source system on a schedule. This Version is read-only. Sacred. You do not touch Actual data in SAC Planning.
Budget 2026 — the annual budget that finance managers enter once a year during the budgeting cycle. Also read-only once the CFO approves and locks it. Before approval — writeable for authorised finance managers.
Rolling Forecast — updated every month by finance managers based on the latest business intelligence. Always writeable for the current and future months. Completed months are locked as soon as actuals arrive.
Prior Year Actual — last year’s actual data. Read-only reference data for year-on-year comparisons. Nobody touches it. It just sits there being useful.
Why does this matter so much?
Because Versions are what make comparison possible. The budget versus actual report that the CFO reviews every Monday morning — that is a single table with four columns showing the same measures across four Versions simultaneously. Revenue Actual. Revenue Budget. Revenue Forecast. Revenue Prior Year. All in one view. All from one Model. All perfectly aligned because they share the same dimension structure.
Without Versions you would need four separate models, four separate connections, complex joins to align them — the kind of thing that in a Databricks world would be a significant pipeline engineering exercise. In SAC it is a configuration choice at model design time.
Marie’s reaction when Laurent explained Versions was characteristically data engineer.
“So a Version is like a partition in Delta Lake — same schema, same table, different data segment identified by a label?”
Laurent thought about it. “Closer than you might think. Except the Version dimension is not just a partition for query performance — it carries business meaning. The Budget Version is governed differently from the Forecast Version. Different people can write to it. Different lock rules apply. It is a partition with business logic attached.”
That is a good way to remember it. Version is a partition with business logic. Not just a filter — a governed data container with its own rules about who can read it, who can write it, and when it gets locked.
Public Version vs Private Version — the safety net that finance teams need
One of the most common fears finance managers have when they first see SAC Planning is this: “What if I change something and break the official budget?”
It is a legitimate fear. In Excel, making a mistake in the wrong file causes real problems. Formulas break. Numbers change. The wrong version gets sent to the CFO.
SAC Planning solves this with Public and Private Versions.
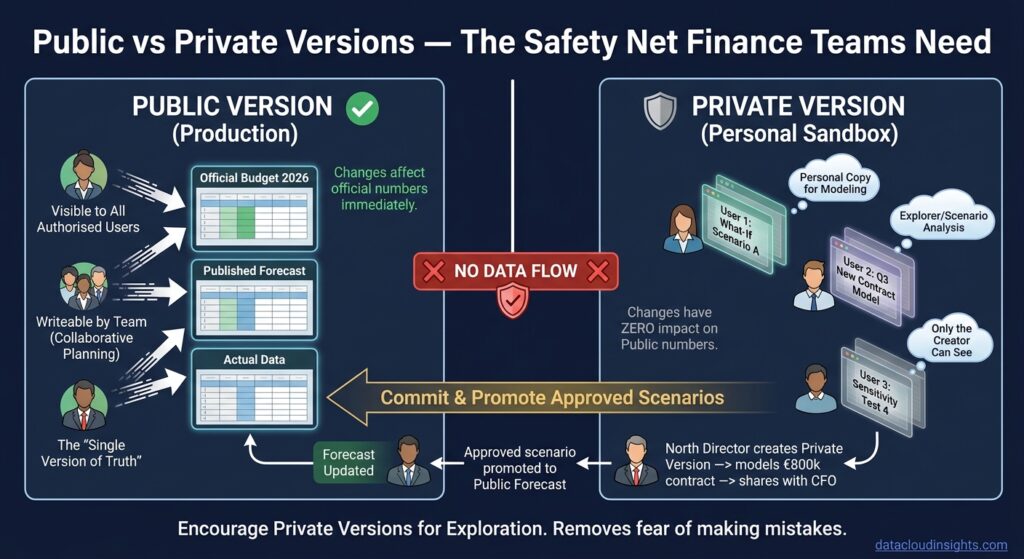
A Public Version is visible to all authorised users. The official Budget 2026, the published Rolling Forecast, the Actual data — these are all Public Versions. When a finance manager enters numbers into a Public writeable Version, those numbers are visible to everyone with access. This is deliberate. Collaborative planning requires shared visibility.
A Private Version is personal. Only the person who created it can see it. It is a personal copy of planning data for scenario modelling — what-if analysis, sensitivity testing, exploratory calculations — without affecting any official numbers.
The North region director at RetailCo wanted to model what would happen to her region’s full year profit if she won a major new retail contract in Q3 worth €800,000. She created a Private Version, copied the current Forecast into it, added the new contract revenue, and modelled the cost implications. She shared the Private Version with the CFO for a discussion. At no point did any official Forecast number change.
When the CFO approved the scenario, the finance team promoted the relevant numbers into the official Rolling Forecast Public Version.
Private Versions are the sandbox. Public Versions are production. Any data engineer reading that sentence just nodded.
The practical advice — always encourage finance team members to use Private Versions for exploratory work during training. It removes the fear of making mistakes. Once they are confident the numbers are right, they commit to the Public Version.
Data Action — automation inside the Planning Model
If Versions are the structure of SAC Planning, Data Actions are the engine.
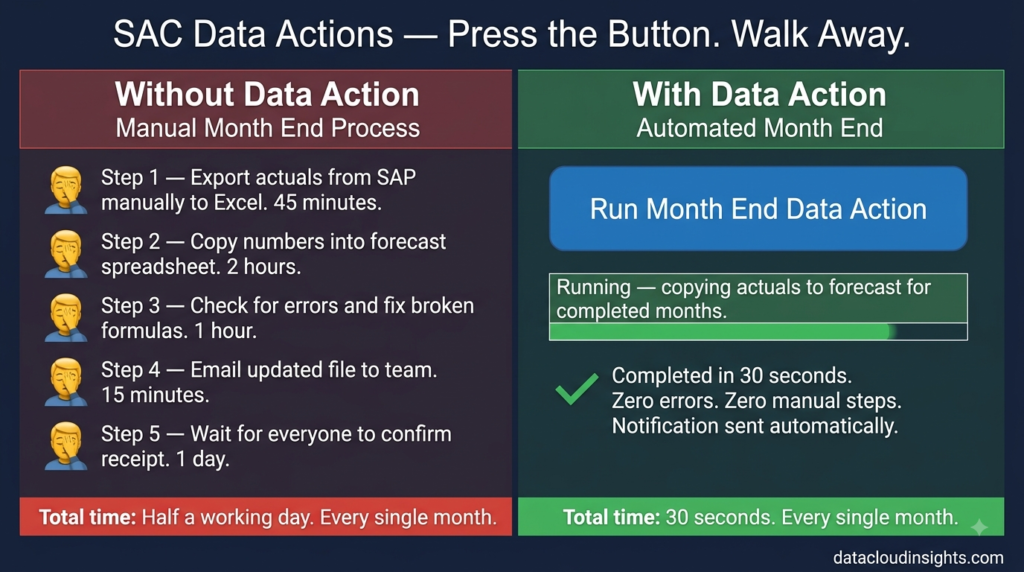
A Data Action is an automated process that runs inside a Planning Model — performing calculations, copying data between Versions, allocating costs, distributing values, or running custom business logic. All without anyone writing a pipeline. All triggered by a button click in a Story or scheduled to run automatically.
The RetailCo Planning Model uses four Data Actions that run regularly throughout the year.
Actuals Copy Data Action — runs on the first working day of every month. Copies the previous month’s Actual data from the Actual Version into the Rolling Forecast Version for that completed month. Finance managers no longer need to manually update completed months in the Forecast — the Data Action does it automatically. What used to take two people half a day in Excel now takes thirty seconds.
Top Down Distribution Data Action — runs when the CFO enters a total annual revenue target for the company. Distributes that total across the four regions based on each region’s share of prior year revenue. The North region contributed 32 percent of last year’s revenue — it gets 32 percent of the new target. Automatically. No manual calculation. No Excel formulas. No arguments about the distribution methodology.
Cost Allocation Data Action — runs monthly. Allocates shared central costs — IT, HR, Legal, Finance — across all cost centres based on headcount. The IT costs get split across every cost centre proportionally to how many employees work there. In Excel this was a manual process that took the finance team three days every month end. In SAC it runs in four minutes.
Variance Alert Data Action — runs weekly. Compares Actual to Budget for every cost centre. For any cost centre where actual spending exceeds budget by more than 10 percent, it flags the cost centre and sends an automated notification to the relevant cost centre manager.
From a data engineering perspective Data Actions feel familiar. They are essentially transformation jobs — business logic applied to data inside the system. The difference from a Databricks notebook or an ADF pipeline is that Data Actions live inside SAC and operate on SAC Planning Model data directly. No external compute. No pipeline orchestration. No landing zones.
The trade-off is flexibility. Data Actions are powerful within their defined scope — copy, distribute, allocate, calculate. They are not general-purpose transformation engines. For complex transformations that go beyond what Data Actions can handle natively, the pattern is to do the heavy transformation in Databricks or dbt and land the result in SAC via an import. Use each tool for what it does best.
Spreading — the feature that makes finance managers forgive SAC for not being Excel
Marie witnessed the moment that converted the most Excel-attached finance manager on the RetailCo project.
His name was Bernard. Fifteen years in finance. Legendary creator of a 47-tab Excel budget model that only he fully understood. He had been openly sceptical of SAC Planning since the project kickoff.
On day two of the planning workshop Laurent demonstrated Spreading.
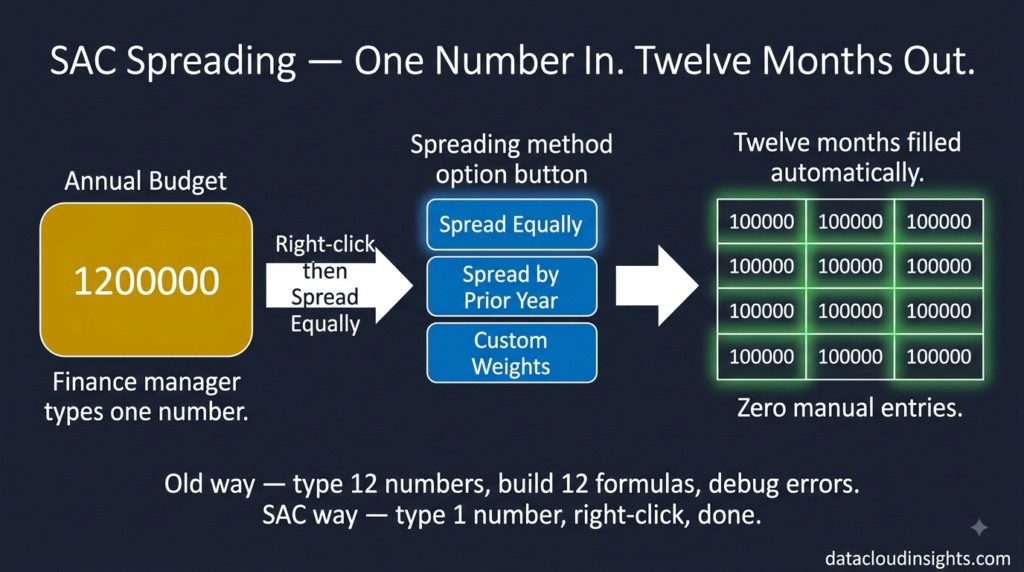
Bernard had entered an annual marketing budget of €1,200,000 as a single number in the annual total column of the planning table.
Laurent right-clicked the cell.
A context menu appeared with Spreading options.
He selected Spread Equally.
SAC instantly populated twelve monthly cells — €100,000 each. January through December. One entry. One right-click. Twelve cells filled.
Bernard watched this without expression.
Laurent then right-clicked the same cell again and selected Spread by Prior Year Values. SAC redistributed the €1,200,000 across months proportionally to last year’s actual monthly marketing spend — heavier in Q4 when RetailCo ran its Christmas campaigns, lighter in Q1 and Q2. The seasonal pattern was reflected automatically.
Bernard leaned forward slightly.
Laurent selected a third option — Spread by Custom Weights. A popup appeared letting him enter custom percentages for each month. He typed in the marketing team’s planned campaign schedule — 5% in January, 4% in February, 6% in March, and so on until the twelve percentages added to 100%.
SAC recalculated all twelve months instantly.
Bernard was quiet for a moment.
“In Excel,” he said finally, “I have a tab called Monthly Distribution that I update every year. It has formulas that have been there since 2019. I do not fully remember how some of them work.”
Laurent nodded sympathetically.
“How long does updating it take?”
“Half a day. Sometimes more if something breaks.”
“This takes thirty seconds.”
Bernard did not say anything else. But he never questioned SAC Planning again for the rest of the project.
Spreading is simple in concept — enter a total value and let SAC distribute it across time periods or dimension members using a defined method. Equally, proportionally, by reference data, by custom weights. The business impact is significant because manual monthly distribution is one of the most time-consuming and error-prone parts of any Excel-based budgeting process.
The options vary slightly depending on model configuration but the principle is always the same. One number in. Multiple cells out. Consistently. Instantly. Without formulas that nobody remembers writing.
Data Locking — governance that Excel never had
Here is a scenario that every finance professional has experienced.
The annual budget is approved by the board in February. Locked. Official. Done.
In March someone — not maliciously, just carelessly — opens the budget Excel file, changes a number, and saves it. Maybe they were testing something. Maybe they confused it with the forecast file. The change is small. Nobody notices immediately.
In June the CFO asks why the June budget variance looks different from what the board approved. Someone investigates. The March change is found. Nobody remembers making it. There is no audit trail. Three weeks of investigation follow.
This scenario is so common in Excel-based planning environments that most finance teams have learned to live with the constant background anxiety that budget files might have been accidentally changed.
SAC Planning Data Locking eliminates this scenario completely.
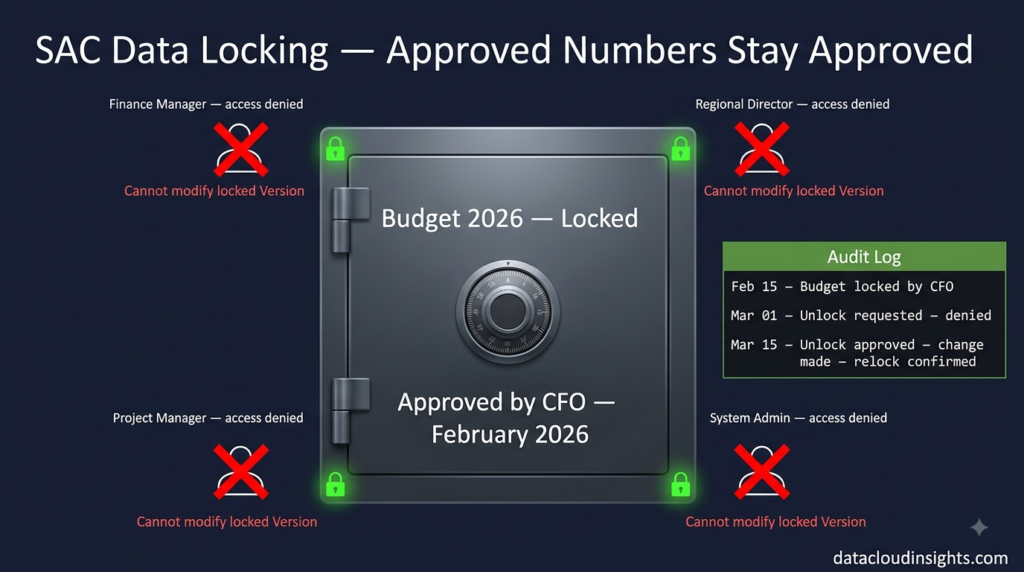
Data Locking restricts editing of specific planning data — by Version, by time period, by dimension member, or by combination. Once data is locked, it cannot be changed by any user regardless of their role — unless an administrator explicitly unlocks it.
RetailCo’s locking strategy is straightforward.
The Budget 2026 Version is locked in its entirety the moment the CFO approves it in the February board meeting. From that point forward, not even Laurent can change a Budget number in SAC without going through a formal change request process that includes unlocking, making the change, relocking, and documenting the change in the audit log.
The Rolling Forecast Version is locked by time period. January is locked on the first working day of February when actuals are confirmed. February is locked in March. Each month locks as it closes. Finance managers can always update the current and future months but can never go back and change a closed period.
Individual cost centre data is locked by the cost centre owner as they complete their budget input. Once a cost centre manager clicks Submit in their planning Story, their data is locked for that planning round. Only the regional director can unlock it if something needs to change — and that unlock is logged.
From a data engineering perspective Data Locking is a governance mechanism — the equivalent of write permissions and partition-level access controls in Delta Lake. In Delta Lake you control who can write to which partitions. In SAC Planning you control who can write to which Version, which time period, and which dimension members.
The difference is that in SAC Planning the locking is a business governance tool, not just a technical permission. Finance managers lock their own data as a deliberate act of sign-off. The lock is a commitment — these are my numbers, I stand behind them.
That business meaning is what makes Data Locking more than just an access control. It is the mechanism that gives SAC Planning its audit trail and its governance credibility — the things that make the CFO trust the numbers that come out of it.
Planning Sequence — orchestrating multiple Data Actions
One more term that comes up constantly in planning projects and deserves a clear explanation.
A Planning Sequence is a workflow that runs multiple Data Actions in a defined order — with optional conditions controlling which steps run based on the state of the data.
Think of it as an orchestration layer for Data Actions. The equivalent of an ADF pipeline that triggers multiple Databricks notebooks in sequence, with conditional branching based on the output of each step.
RetailCo’s month end Planning Sequence runs automatically on the last working day of each month:
Step 1 — Import last month’s actuals from S/4HANA into the Actual Version.
Step 2 — Validate that the import completed successfully. If not — stop and send an alert.
Step 3 — Run the Actuals Copy Data Action to update the Rolling Forecast completed months.
Step 4 — Run the Variance Alert Data Action to flag overspending cost centres.
Step 5 — Lock the completed month in the Rolling Forecast Version.
Step 6 — Send notifications to all cost centre managers that the new month’s forecast input window is open.
Six steps. Fully automated. What used to require a finance team member spending two days manually copying numbers, sending emails, and updating spreadsheets now runs in twelve minutes without anyone doing anything.
The data engineer in Marie loved Planning Sequences from the moment Laurent explained them. “It is a DAG,” she said immediately. Directed Acyclic Graph — the structure that orchestration tools like Apache Airflow use to define dependent task execution.
Laurent had not thought about it that way before. But he agreed it was a reasonable comparison.
The difference — Planning Sequences are simpler than a full orchestration DAG. They are linear with conditional branching rather than fully graph-based. For the business logic involved in SAC Planning this is generally sufficient. For very complex orchestration requirements the pattern is to trigger Planning Sequences from an external orchestration tool — but that is an advanced topic for a different article.
What Marie thinks about Planning now
Three weeks after the planning workshop ended Marie was asked in a project retrospective what had surprised her most about SAC Planning.
She thought for a moment. “I came in thinking Planning was the boring part of the project. BI is interesting — pipelines, models, architecture. Planning sounded like just building a form for finance people to type numbers into.”
She paused. “But Planning is actually where SAC replaces the most pain. The BI dashboards are impressive. The planning tools change how the finance team works every single day. The Data Actions alone save them two days of manual work every month end. That is twenty-four days a year. Three working weeks. Per person.”
Laurent, who was also in the retrospective, nodded.
“That is why we always sell Planning alongside BI,” he said. “The dashboards make people say wow. The Planning tools make people say thank you.”
Part 5 is coming next — Security and Administration. Not the most glamorous topic. But the one that causes the most go-live delays when it has not been thought through. Marie learns why Data Access Controls in SAC are both essential and more complex than she expected. Subscribe below.
The complete series:
- Part 1 — Platform basics: SAC, BTP, Tenant, Story, Analytic Application
- Part 2 — Data modelling: Model, Dimension, Measure, Account Dimension, Hierarchy
- Part 3 — Dashboard building: Page, Widget, KPI Tile, Input Control, Drill Down, Linked Analysis
- Part 4 — Planning terms: Version, Data Action, Spreading, Data Locking, Planning Sequence (you are here)
- Part 5 — Security and Admin: Role, Data Access Control, Transport, Content Network
- Part 6 — Connections: CDS View, Cloud Connector, Datasphere, BDC, OData
What to read next on Data Cloud Insights
If this series gave you the foundation you needed — these articles go deeper on specific topics:
- SAP Analytics Cloud Complete Beginner’s Guide
- How to Build Your First SAP Analytics Cloud Story
- SAP Analytics Cloud Data Sources: Complete Connection Guide
- SAP Analytics Cloud Planning: Build Your First Budget Model
- SAP Analytics Cloud Performance: 10 Tips to Make Reports Faster
- SAP Analytics Cloud vs Power BI: Honest Comparison
- SAP Analytics Cloud Certification Guide
Written by someone who has sat through enough month-end close processes in Excel to genuinely appreciate the first time a Planning Sequence runs automatically and nobody has to do anything.

Pingback: SAP Analytics Cloud Dashboards: A Data Engineer's Guide to Building Stories (Part 3)
Pingback: SAP Analytics Cloud Data Modelling: What Data Engineers Need to Know (Part 2)
Pingback: SAP Analytics Cloud Security and Administration: What Beginners Need to Know (Part 5)
Pingback: SAP Analytics Cloud Connections: CDS Views, Datasphere and Cloud Connector Explained (Part 6)