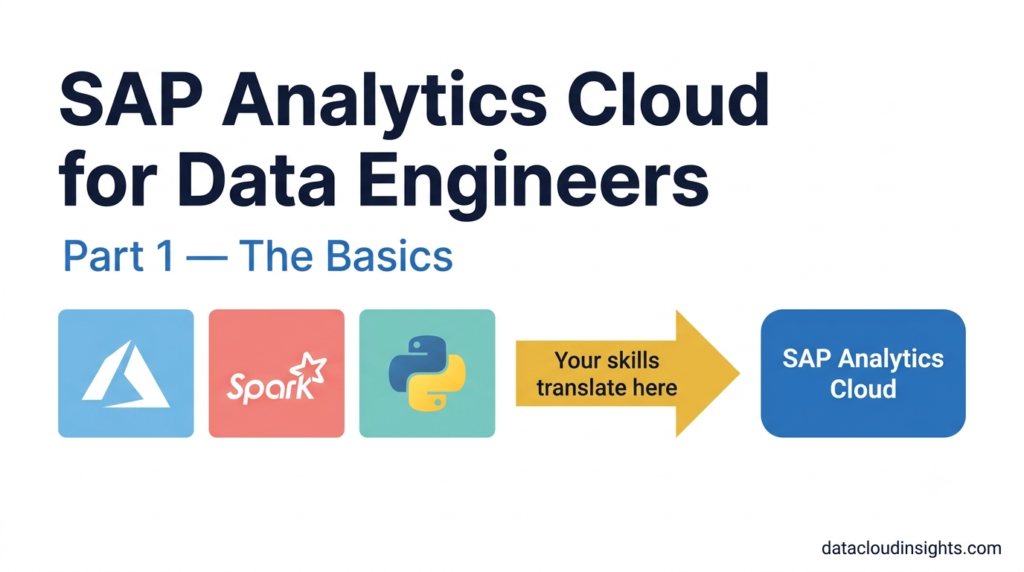

Companies running SAP used to staff their analytics projects almost entirely with SAP functional consultants — people who came up through BW, BusinessObjects, or BPC. But today I regularly work alongside people who come from a completely different world. Databricks. Azure Data Factory. Apache Spark. Python. dbt. They know data deeply — pipelines, transformations, lakehouse architecture, medallion layers. They are genuinely excellent at what they do.
And on their first day of an SAP Analytics Cloud project, they are completely lost. Not because they are not smart. Because SAP has its own vocabulary, its own mental models, its own way of thinking about data and analytics — and nobody hands you a translation guide when you arrive. This post is that translation guide.
We follow Marie through her first weeks on an SAC project. Marie is a data engineer at RetailCo France. She has three years of experience building data pipelines on Azure — Azure Data Factory, Azure Databricks, Delta Lake, Power BI on top. She is genuinely good at her job. She can write PySpark in her sleep and has strong opinions about data modelling.
She has never opened SAP in her life. Her manager just put her on the company’s SAP Analytics Cloud implementation as the data engineering representative. The idea is that Marie bridges the SAP consultants and the Azure data platform the company already runs.
Good idea in theory. Day one in practice — Marie is drowning. Let us fix that.
The kickoff meeting
Day one. Marie walked into the project kickoff carrying her MacBook and a coffee. Around the table — four SAP consultants, the IT director, the CFO, and a few business representatives from finance and logistics.
The lead consultant opened the meeting.
“Today we kick off the RetailCo SAP Analytics Cloud implementation. We will build a complete analytics and planning solution on SAC, running on BTP, deployed across three tenants — development, QA, and production. Business users will access Stories built by the team, and the finance team will use the Planning module for the annual budget cycle. Some complex requirements will go into Analytic Applications.”
Marie opened a new note on her MacBook.
She typed five words with question marks next to all of them.
SAC. BTP. Tenant. Story. Analytic Application.
Then she closed the note and spent the rest of the meeting asking smart questions about data volumes and source system architecture — which was genuinely useful — while quietly planning to figure out the SAP vocabulary later.
This is that later.
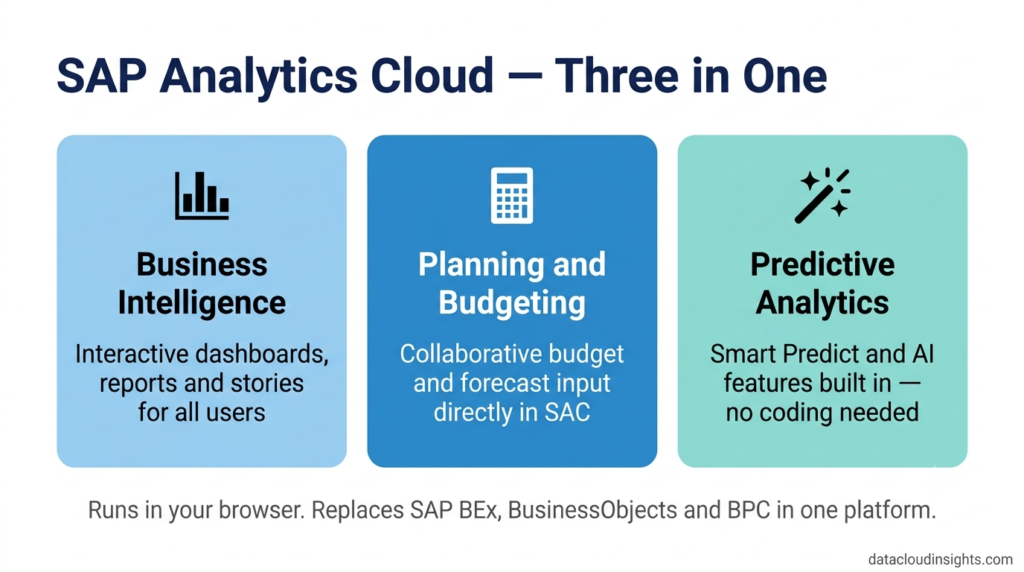
SAP Analytics Cloud — the Databricks of the SAP world. Sort of.
Marie’s first question when I explained SAC to her was direct and very data engineer.
“Is it a compute layer? A visualisation layer? A storage layer? What does it actually do?”
Fair question. In the Azure world everything has a clear job. Azure Data Factory moves data. Databricks transforms it. Delta Lake stores it. Power BI visualises it. The layers are separated and each tool does its job.
SAC is different. SAC deliberately combines layers that the modern data stack keeps separate.
Think of it this way. In the Azure world Marie knows, a typical analytics setup looks like this — data lands in a storage account, gets processed in Databricks, lands in a Delta Lake gold layer, and Power BI sits on top for visualisation. Four tools, four layers, clear handoffs between them.
SAC collapses some of that. It has its own data modelling layer — not as powerful as Databricks but purpose-built for business analytics. It has its own visualisation layer — dashboards and reports built directly in the tool. And it has a planning layer that has no real equivalent in the Azure world at all — a place where finance users can actively write data back into the system, entering budgets and forecasts directly.
So if you are looking for a single Azure equivalent — there is not one. SAC is closer to Power BI plus some elements of a planning tool like Anaplan, running entirely in the browser, with native connections to SAP source systems.
The browser part surprised Marie. She expected to install something.
“Just Chrome?” she asked.
Just Chrome.
She logged into the SAC trial that evening out of curiosity. Within twenty minutes she had built a chart from sample data, applied a filter, and watched everything on the page update in real time. She sent me a message at 10pm that said “okay this is more impressive than I expected.”
That reaction is common. SAC looks simple on the surface. The depth reveals itself over time.
BTP — think of it as Azure but built by SAP
Marie understood BTP fastest of all the five terms. Because she lives in Azure every day.
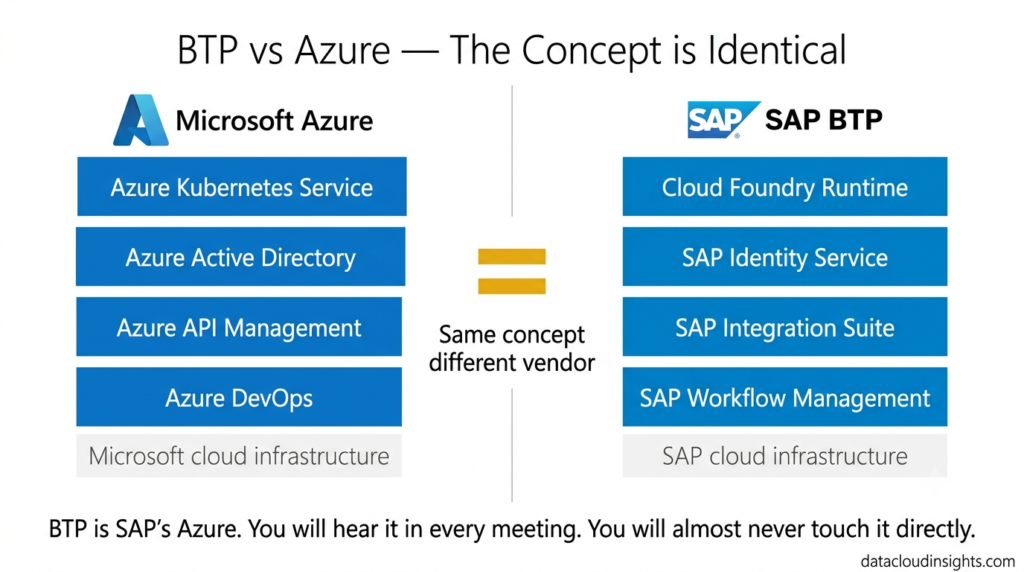
BTP stands for SAP Business Technology Platform. It is SAP’s cloud platform — the infrastructure layer that hosts SAC, manages connections between SAP systems, handles authentication, and provides the runtime environment for everything modern SAP runs on.
When I described it to Marie I said — “BTP is SAP’s Azure. It is their cloud platform. SAC runs on BTP the way a Power BI workspace runs on Azure. The connections between SAC and your S/4HANA system are configured in BTP the way you would configure a linked service in Azure Data Factory. The authentication uses OAuth flows managed in BTP the way you manage service principals in Azure Active Directory.”
Marie nodded slowly. “So BTP is the cloud plumbing.”
Exactly. Cloud plumbing.
The important thing for Marie to understand — and for you if you come from a similar background — is that BTP is mostly a concern for the technical architects and the basis team on an SAP project. You will hear it in every architecture discussion. You will not usually need to log into it yourself. When someone says “we configure the connection in BTP” — that is an infrastructure task, the equivalent of setting up a linked service or a managed identity in Azure. Important work. Usually not yours as a functional or data team member.
Unless you are the technical lead. In which case BTP becomes very much your world and you should read the BTP documentation carefully. But that is a different article.
Tenant — like a Databricks workspace, but with three of them
Marie knows workspaces. In Azure Databricks, a workspace is an isolated environment for a team or project — its own clusters, its own notebooks, its own storage mounts, its own access controls. One company might have a development workspace, a staging workspace, and a production workspace. Completely separated. You do not run production jobs in the dev workspace. You do not test experiments in production.
SAC tenant is the same concept at the company level.
When RetailCo bought SAC, SAP provisioned a dedicated tenant specifically for RetailCo. Not a shared environment. Not a partition of someone else’s system. A completely isolated cloud environment — RetailCo’s own private SAC instance. Their dashboards, their data models, their users, their configurations. Nobody outside RetailCo can see it. RetailCo cannot see any other company’s tenant.
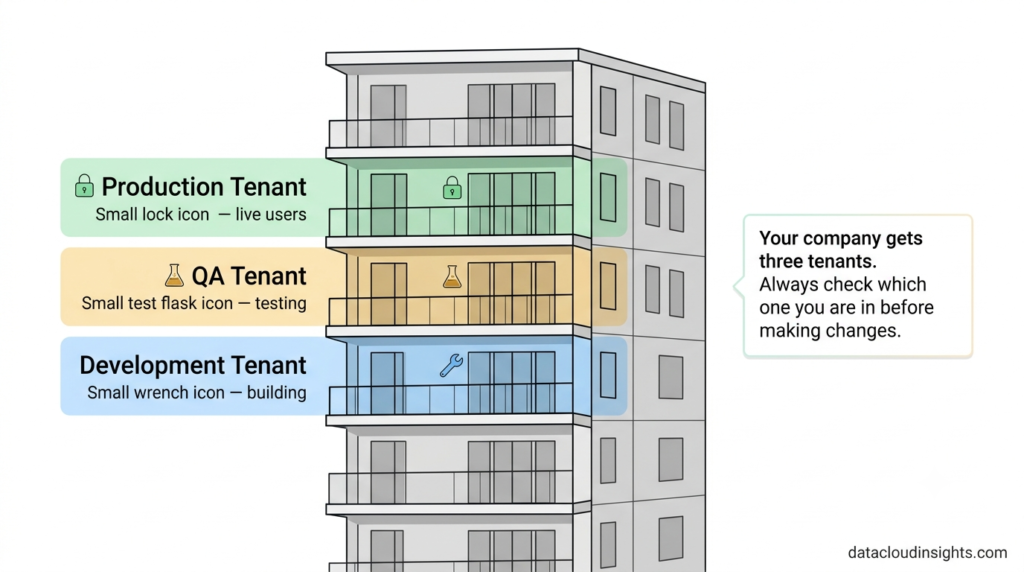
And exactly like Databricks workspaces, RetailCo has three tenants:
Development tenant — where the SAP consultants build everything first. The equivalent of the dev workspace where you write new notebooks and pipelines before they go anywhere near real data.
Quality assurance tenant — where the business team tests before anything goes live. The equivalent of staging — real-ish data, real workflows, but not the system people depend on daily.
Production tenant — the live system. The equivalent of the production workspace that runs the nightly jobs your company depends on. You treat it accordingly.
Marie understood this immediately. She deals with workspace separation every day.
Then on day eight she made the classic mistake anyway.
She was reviewing planning data in what she was certain was the QA tenant. She deleted forty rows of data she thought were test entries. The kind of cleanup she would do without thinking in a Databricks dev workspace.
The problem was she had the wrong browser tab open. She was in production.
The data was real. Finance had spent two days entering it. Restoring from backup took three hours.
I tell this story not to be cruel — because the same thing happens to experienced SAP people all the time — but because the lesson is important. In Databricks you can see clearly which workspace you are in from the URL and the workspace name in the top corner. In SAC the tenant name is in the URL. Check it every single time before you do anything. Before you delete. Before you modify. Before you run a data action.
Prod is prod. Whether it is a Databricks workspace or an SAC tenant.
Story — like a Power BI report, but native to SAP
Marie knows Power BI. RetailCo’s current analytics setup runs on Azure Databricks feeding Power BI. She has built Power BI reports before — connected them to Delta Lake tables, built DAX measures, designed report pages, published to the Power BI service.
So when I explained Stories I started there.
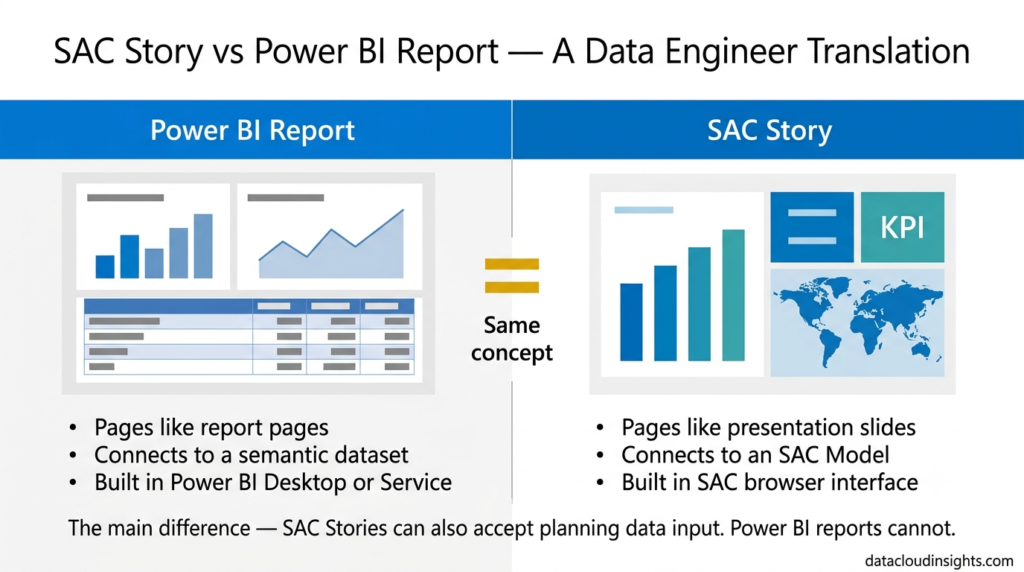
“A Story in SAC is the equivalent of a Power BI report. A collection of pages, each containing charts, tables, KPI numbers, and filters — designed to answer specific business questions for specific users. The CFO revenue overview is a Story. The budget versus actual report the finance team uses every month is a Story. The logistics performance dashboard the warehouse managers check every morning is a Story.”
Marie asked the same question a data engineer always asks.
“What is the data model behind it?”
Good question. In Power BI you connect to a dataset — a semantic model with defined measures and dimensions. In SAC you connect to an SAC Model — which serves the same purpose. The Story is the visualisation layer. The Model is what it connects to. We will cover Models in Part 2 of this series.
“And building a Story — is that SQL? DAX? Python?”
None of the above. Stories are built with drag and drop. You drag a dimension onto a chart axis. You drag a measure onto the values field. You choose a chart type. SAC renders it. No code for standard Stories.
Marie’s reaction to this was mixed — as it often is with data engineers.
“So it is like a no-code tool.”
“For Stories yes. Think of it the way you think about Power BI Desktop. You can do a lot without writing DAX. You write DAX when standard functionality is not enough. Same in SAC — you can go very far without scripting. Scripting comes later when you need custom logic.”
Thomas showed Marie a demo Story on day five. She spent twenty minutes clicking through it — applying filters, drilling into regions, switching between chart types. Her only comment was that the live connection to the S/4HANA system meant the data was always current without any pipeline running in the background.
“No pipeline?” she asked.
“No pipeline. It queries S/4HANA directly.”
She sat with that for a moment. In her Azure world, getting data from an SAP system into a visualisation tool involves ADF pipelines, landing zones, Databricks transformations, Delta tables, and then Power BI on top. The idea that SAC could skip most of that and query the source directly — in real time — was genuinely surprising to her.
It is one of SAC’s real strengths for SAP-heavy organisations. The native connectivity eliminates a significant part of the data engineering work that tools like Power BI require when connecting to SAP.
Analytic Application — like a custom Dash or Streamlit app sitting inside SAC
This one took Marie a moment. Because there is no perfect Azure equivalent.
Let me try the analogy I used with her.
In Marie’s Azure world, when a standard Power BI report is not enough — when someone needs a custom interactive tool with specific business logic, dynamic calculations triggered by user input, personalised outputs based on who is logged in — the data team sometimes builds a custom web application using Python. Plotly Dash or Streamlit. A proper app with custom logic, not just a report.
An Analytic Application in SAC is that idea — but built inside SAC itself using SAC’s scripting language.
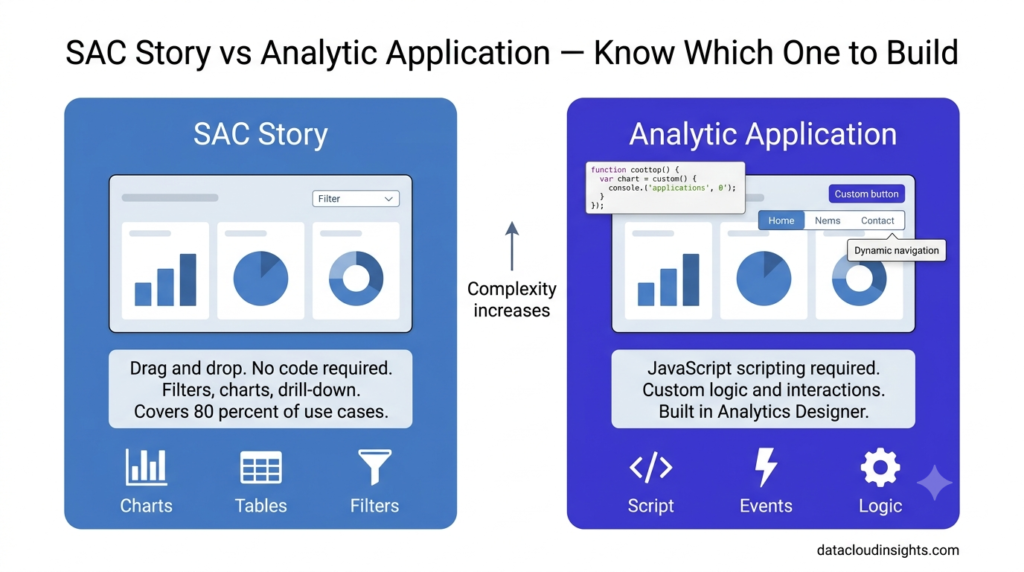
Standard Stories handle the vast majority of analytics requirements. Clean dashboards, interactive filters, drill downs, KPI tiles. Like a well-built Power BI report — no code needed, covers most use cases.
But some requirements need custom behaviour. The RetailCo store manager self-service tool needed a button that triggered a custom calculation sequence, generated a personalised performance summary for that specific store, highlighted the three biggest problem areas based on defined thresholds, and let the manager add comments directly in the interface. You cannot build that with drag and drop. You need to script it.
That is what Analytics Designer is for — SAC’s development environment where consultants write JavaScript-based script to create custom interactive behaviour. And the output of that development work is called an Analytic Application.
Marie asked the smart question.
“Can I build these? I write Python. How different is the scripting?”
Honestly — it is not Python. It is JavaScript-based and SAC has its own API that you need to learn. But data engineers generally pick it up faster than people from a pure business background because the logic of event-driven programming — when this happens, do that — is familiar territory.
Whether Marie builds Analytic Applications on her project depends on the project setup. On this project the plan was for the SAC developer to handle scripting while Marie focused on the data layer — the connections between the Azure data platform and SAC. But she is on the list to learn Analytics Designer in phase two.
For your first project — know what Analytic Applications are, know when a requirement needs one instead of a Story, and know that they require development skills to build.
End of week one
Friday. Marie is on the RER back to Paris. Her MacBook is on her lap — she is reviewing the SAC trial tenant she set up on her personal account.
She has been clicking around for twenty minutes. She built a small chart from sample data. She connected it to a second chart and set up linked analysis between them — clicking on one automatically filtered the other. She spent ten minutes just clicking back and forth watching them respond to each other.
She opened her notes app and wrote five lines.
SAC — browser-based analytics platform combining visualisation, planning, and AI. No pipeline needed for SAP data sources. Think Power BI plus Anaplan but native to SAP.
BTP — SAP’s Azure. Cloud infrastructure platform. Technical team manages it. Not my daily concern unless I take the technical architect role.
Tenant — SAP’s version of a Databricks workspace. Three of them per project. Dev, QA, prod. Check the URL before touching anything. Ask Marie about the time she deleted prod data.
Story — SAP’s equivalent of a Power BI report. Pages, charts, tables, filters. Built with drag and drop not code. Connects to an SAC Model the way a Power BI report connects to a dataset.
Analytic Application — custom app built inside SAC using JavaScript-based scripting. Like Dash or Streamlit but living inside the SAP ecosystem. Developer territory for now — learn Analytics Designer in phase two.
She closed the note and looked out the train window at the Paris suburbs passing in the dark.
Next week is the data modelling workshop. The SAP consultants have been talking about dimensions, measures, hierarchies, and account models all week. Marie has been nodding along while internally mapping everything to concepts she knows from Delta Lake and dbt.
Some of those mappings will be right. Some will be dangerously wrong.
Part 2 — where Marie walks into the data modelling workshop armed with Delta Lake mental models and discovers which ones translate and which ones get her into trouble. Subscribe below.
The complete series:
- Part 1 — Platform basics: SAC, BTP, Tenant, Story, Analytic Application (you are here)
- Part 2 — Data modelling: Model, Dimension, Measure, Account Dimension, Hierarchy
- Part 3 — Dashboard building: Page, Widget, KPI Tile, Input Control, Drill Down, Linked Analysis
- Part 4 — Planning terms: Version, Data Action, Spreading, Data Locking, Planning Sequence
- Part 5 — Security and Admin: Role, Data Access Control, Transport, Content Network
- Part 6 — Connections: CDS View, Cloud Connector, Datasphere, BDC, OData
What to read next on Data Cloud Insights
If this series gave you the foundation you needed — these articles go deeper on specific topics:
- SAP Analytics Cloud Complete Beginner’s Guide
- How to Build Your First SAP Analytics Cloud Story
- SAP Analytics Cloud Data Sources: Complete Connection Guide
- SAP Analytics Cloud Planning: Build Your First Budget Model
- SAP Analytics Cloud Performance: 10 Tips to Make Reports Faster
- SAP Analytics Cloud vs Power BI: Honest Comparison
- SAP Analytics Cloud Certification Guide
Written by someone who has spent the last three years watching excellent data engineers and SAP consultants talk past each other on the same project — and trying to build the bridge between them.


SAP HANA Cloud is a completely overseen in-memory cloud information base as a help (DBaaS).
As the cloud-based information establishment for SAP Business Technology Platform, it
coordinates information from across the undertaking, empowering quicker choices in view of live information.
The Business Technology Platform – Cloud Foundry preparing and affirmation course acquaints you with the tremendous capability of SAP Business Technology Platform
and gives active involvement with utilizing this
open stage.
The Cloud Foundry climate permits you to make bilingual cloud applications in Cloud Foundry.
It contains the SAP Cloud Platform, Cloud Foundry runtime
administration, which depends on the open-source application stage oversaw by
the Cloud Foundry Foundation.
The Cloud Foundry climate empowers you to foster new business applications
and business administrations, supporting numerous runtimes, programming dialects,
libraries, and administrations. You can use a huge number of buildpacks, including local
area advancements and self-created fabricate
packs. It likewise coordinates with SAP HANA expanded application administrations,
progressed model (SAP HANA XSA).
Get experienced on https://www.anubhavtrainings.com/hana-cloud-development-btp you to
develop new business applications and business services,
supporting multiple runtimes, programming languages, libraries, and services.
You can leverage a multitude of buildpacks, including community innovations and self-developed build
packs
Pingback: SAP Analytics Cloud Security and Administration: What Beginners Need to Know (Part 5)
Pingback: SAP Analytics Cloud Connections: CDS Views, Datasphere and Cloud Connector Explained (Part 6)
Pingback: SAP Business Data Cloud and Databricks: Integration Guide for Data Engineers 2026 (Part 3)
Pingback: 40 SAP Analytics Cloud Terms Every Beginner Must Know (2026)